Weekly Trading Analysis: Week Ending 2026-07-12 #
Weekly Summary #
The combined portfolio value increased from $265,483.78 last week to $267,788.02, a gain of $2,304.24 (+0.87%). Both brokerages contributed positively.
| Metric | Current | Last Week | Change ($) | Change (%) |
|---|---|---|---|---|
| IBKR Portfolio Value | $83,320.00 | $82,600.00 | +$720.00 | +0.87% |
| Binance Portfolio Value | $184,468.02 | $182,883.78 | +$1,584.24 | +0.87% |
| Total Portfolio Value | $267,788.02 | $265,483.78 | +$2,304.24 | +0.87% |
| IBKR Unrealized P&L | -$17,630.00 | -$18,010.00 | +$380.00 | +2.11% |
| Binance Floating P&L | -$54,636.41 | -$56,074.06 | +$1,437.65 | +2.56% |
| IBKR Buying Power | $465,000 | $462,500 | +$2,500 | +0.54% |
| IBKR Total Cash | $44,200 | $44,000 | +$200 | +0.45% |
No trades were executed during the period, so all changes are market-driven.
Open Positions #
IBKR (Traditional Brokerage) #
| Symbol | Qty (Δ) | Cost Basis | Market Value (Δ) | P&L (Δ) |
|---|---|---|---|---|
| ATOS | 80 (0) | $3,542.00 | $189.60 (+$23.20) | -$3,352.00 (+$24.00) |
| BLZE | 100 (0) | $2,271.00 | $1,774.00 (+$218.00) | -$497.61 (+$217.55) |
| BLZE Aug21 26 20C | -1 (0) | -$154.60 | -$213.23 (-$68.90) | -$58.63 (-$68.90) |
| PLTR Jul17 26 145C | 1 (0) | $921.05 | $14.15 (-$95.85) | -$906.89 (-$95.84) |
| PSFE | 50 (0) | $2,992.00 | $403.50 (-$17.00) | -$2,589.00 (-$17.00) |
| TWLO | 35 (0) | $10,711.00 | $7,510.00 (+$183.00) | -$3,201.00 (+$183.00) |
| UBER | 500 (0) | $46,048.00 | $37,270.00 (+$95.00) | -$8,778.00 (+$95.00) |
| UBER Jul17 26 70C | -5 (0) | -$1,676.00 | -$2,398.00 (+$153.00) | -$722.00 (+$152.36) |
Δ shows change from last week. P&L is unrealized.
Binance (Cryptocurrency) #
| Symbol | Qty (Δ) | Cost Basis (Δ) | Market Value (Δ) | P&L (Δ) |
|---|---|---|---|---|
| RWUSD | 130,556.67 (+84.09) | $130,565.68 (+$98.34) | $130,565.68 (+$98.34) | $0.00 (NA) |
| ETH | 29.0620 (+0.0028) | $107,590.52 (+$50.02) | $52,704.31 (+$1,547.56) | -$54,886.21 (+$1,497.54) |
| GRAM | 509.49 (+0.056) | $0.00 (0) | $833.74 (-$59.67) | $833.74 (-$59.67) |
| EURI | 261.01 (+0.08) | $297.61 (-$0.76) | $297.61 (-$0.76) | $0.00 (NA) |
| G | 16,089.79 (0) | $637.98 (+$1.36) | $54.04 (+$1.14) | -$583.94 (-$0.22) |
| CATI | 190.35 (0) | $7.55 (-$2.14) | $7.55 (-$2.14) | $0.00 (NA) |
Cost basis for Binance is derived from market value and floating P&L; for stablecoin-like assets it equals market value. Δ shows change from last week. P&L is unrealized.
Positions Entered This Week #
None – no trades were placed.
Positions Closed This Week #
None – no trades were placed.
Analysis & Observations #
The portfolio saw modest gains driven primarily by a recovery in Ethereum and slight upticks in several equities.
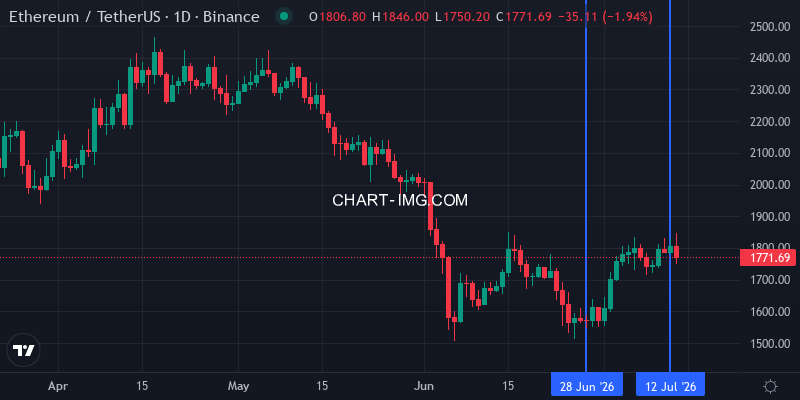
Ethereum remains the largest single position (by market value) and also the biggest source of unrealized losses. This week it gained ~3% (+$1,547.56 in value), improving its floating P&L by about $1,500. Despite this, it is still down over 50% from its cost basis. The small increase in ETH quantity (+0.0028) suggests staking rewards continue to accrue.
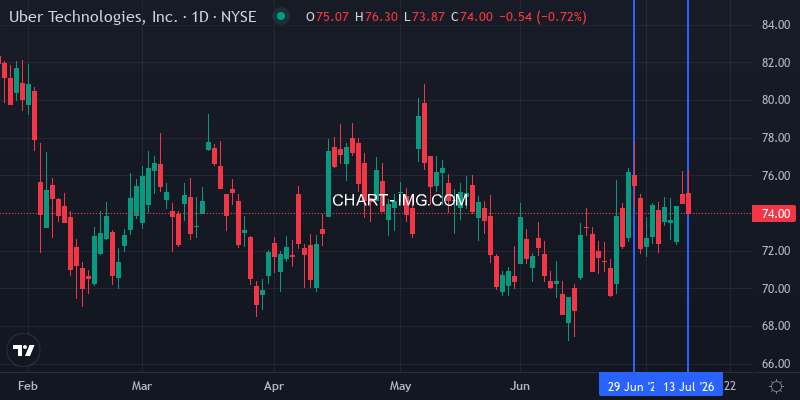
UBER stock edged higher (+$95, +0.26%) and the short put options also improved, reflecting stable or slightly bullish sentiment. UBER remains the largest equity holding.
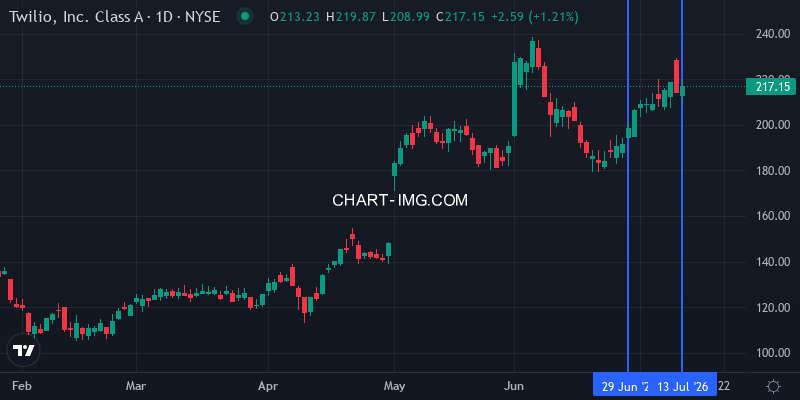
TWLO had a decent week, adding $183 (+2.5%) in value, narrowing its unrealized loss.
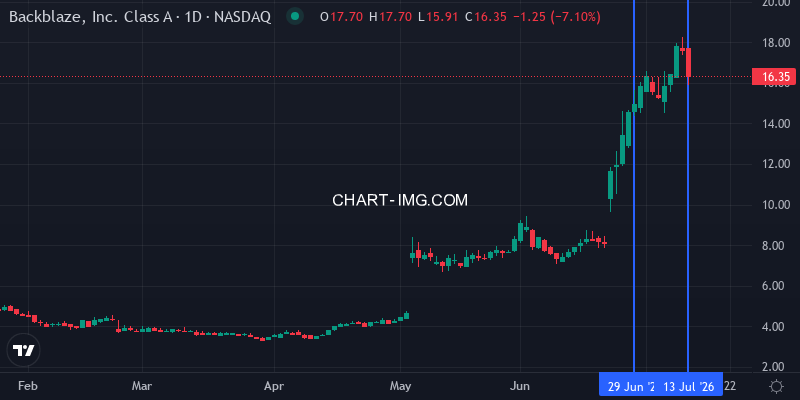
BLZE saw a significant rally of about 14% (+$218 on the stock), but the call option position lost value (-$68.90) due to time decay and possibly volatility changes. This highlights the risk of holding options in a position that rises but not enough to offset option premium decay.
PLTR call option continued its decline, losing almost $96, now worth just $14.15 – effectively worthless with expiration in one week. This position will likely expire worthless unless PLTR sees an improbable surge.
PSFE edged lower, losing $17.
Binance stablecoins (RWUSD, EURI, CATI) generated small positive returns from interest/appreciation, adding around $98 to the total portfolio.
Overall, the portfolio remains heavily skewed towards crypto (approximately 69% of total value) and has substantial unrealized losses. The improvement this week was welcome but modest in the context of the overall deficit.
Charts #
The following charts illustrate the price action of the largest and most volatile holdings over the analysis period.
UBER (NASDAQ)
📊 Charts #